
The Other Side of the Wall: Troy’s 2024 Opponent Preview
Troy’s great local journalists have been working all spring and summer to keep you informed about the new-look Trojan staff and team. Even with the return of College Football 25, you get a functional (if perhaps sometimes inaccurate) representation of this year’s team.
Our grand tradition here at the Trojan Wall is giving you a glimpse at the Other Side. Before the season gets started, I’m going to comb through the data from last year to tell us what we might expect from the teams on the other sidelines this year.
Now, there’s a ton of stats to go through, so we’ll take this one step at a time. First, let’s look at the offensive tendencies (and success) from Troy’s 2024 opponents… in 2023.
| Team | 23 Rush Off/Rk | 23 Pass Off/Rk |
|---|---|---|
| Nevada | 124.8 (98) | 175.2 (111) |
| @ Memphis | 152.0 (75) | 306.5 (10) |
| @ Iowa | 115.9 (107) | 118.6 (127) |
| Florida A&M | 138.1 | 236.5 |
| ULM | 146.1 (80) | 174.8 (112) |
| Texas State | 186.7 (26) | 270.9 (28) |
| @ South | 172.0 (48) | 268.2 (32) |
| @ Arkansas St | 147.6 (78) | 226.0 (62) |
| Coastal | 154.6 (69) | 261.6 (38) |
| @ GA Southern | 117.2 (106) | 302.2 (13) |
| @ Louisiana | 175.7 (41) | 216.7 (74) |
| Southern Miss | 162.8 (58) | 190.7 (101) |
The first thing that stands out to me is how strong the passing game was for many of these teams. Memphis, Texas State, South Alabama, Coastal Carolina, and Georgia Southern all lived in the top 40, and the Tigers are the only ones with a returning starting QB.
He’s also the highest-rated G5 QB in College Football 25. No pressure.
I also say that sarcastically to Texas State, who somehow landed 2023 Sun Belt Player of the Year Jordan McCloud. That story isn’t going away, especially when he comes back to the Vet for a second year in a row.
He went 17-for-25 with 187 yards and a TD, but Troy held him to -21 yards rushing—his worst performance of the regular season.
Speaking of rushing, Texas State stands out as the only team in the top 40 in both columns, and the Bobcats paired McCloud with Ismail Mahdi, a 2023 All-American who put 128 yards on the Trojans last year.
Those two weapons alone are the reason Texas State beat Troy to be favorites in the West, at least according to Sun Belt coaches.
The two worst statistical offenses are Troy’s other FBS non-conference competition, Iowa and Nevada.
The Hawkeyes were a marvel last year, sort of an inverse-Trey State, so to speak. The offense was appalling, but the stout defense forced low-scoring games and somehow Iowa took a 10-win season into the Big Ten championship.
Honestly, the Iowa defense was only comparable to the 2023 Troy team, at least among the programs we’re dissecting.
As for Nevada, the defensive outlook was equally bleak. The Wolf Pack is the only opponent with bottom-40 ratings in all four categories.
| Team | 23 Rush Def/Rk | 23 Pass Def/Rk |
|---|---|---|
| Nevada | 187.8 (117) | 254.1 (112) |
| @ Memphis | 155.2 (77) | 268.0 (121) |
| @ Iowa | 111.8 (15) | 170.7 (5) |
| Florida A&M | 95.4 | 165.7 |
| ULM | 170.9 (101) | 274.9 (122) |
| Texas State | 151.3 (69) | 246.3 (100) |
| @ South | 113.7 (19) | 199.5 (28) |
| @ Arkansas St | 184.2 (113) | 259.4 (119) |
| Coastal | 167.8 (97) | 211.8 (44) |
| @ GA Southern | 161.4 (86) | 234.5 (80) |
| @ Louisiana | 170.8 (100) | 215.0 (51) |
| Southern Miss | 178.8 (111) | 242.0 (96) |
Arkansas State, ULM and Nevada all had 100+ rankings in both rush yards AND pass yards allowed. Southern Miss was close, with a 96 in pass defense.
Each of those 100+ rankings coincides with a 30+ point total against 2023 Troy. It’s probably going to be safe to assume that trend continues, with a more offense-minded head coach.
The last two years, Troy was undefeated when it rushed for 100 yards at least.
All of these teams gave up 150 yards rushing each game except 3: Iowa, South Alabama and Florida A&M, the reigning 12-1 Black College Champions.
The Rattlers are not a team to overlook, even if they lost their head coach and 20 starters. FAMU won the Black College title in 2019, too, a year after Troy thrashed them 59-7.
At the very least, the Rattlers are a more impressive foe than Nevada, holding opponents under 170 yards passing each game.
Not even Iowa did that.
On top of the rushing dominance, the Hawkeyes, the Rattlers and the Jaguars each held opponents under 200 passing yards.
Coastal Carolina and Louisiana sat right outside the top 40, only giving up an extra 15 yards beyond that.
For comparison, Coastal was the second-best eligible team in the Sun Belt East, and Louisiana kept the loss within a single score… something only Western Kentucky was able to do (and technically JMU and Duke too).
That’s the rub though. I’ve mentioned 13 teams total in this block of text. Eight of them all have new head coaches.
The stats are one thing, but how much different is each roster compared to last year’s version?
| Team | FPI Win% | Ret Prod/Rk | Ret Off/Rk | Ret Def/Rk |
|---|---|---|---|---|
| Nevada* | 82.5 | 59% (79) | 62% (65) | 55% (79) |
| @ Memphis | 39.4 | 69% (26) | 74% (29) | 65% (45) |
| @ Iowa | 23.6 | 69% (30) | 80% (12) | 58% (65) |
| Florida A&M* | 96.9 | N/A | N/A | N/A |
| ULM* | 81.8 | 40% (125) | 39% (120) | 41% (117) |
| Texas State | 63.0 | 60% (77) | 54% (91) | 65% (42) |
| @ South* | 53.1 | 41% (120) | 39% (119) | 44% (113) |
| @ Arkansas St | 55.6 | 69% (27) | 82% (8) | 56% (75) |
| Coastal | 60.5 | 45% (114) | 44% (112) | 46% (111) |
| @ GA Southern | 55.9 | 50% (97) | 35% (124) | 66% (40) |
| @ Louisiana | 53.4 | 73% (13) | 73% (31) | 73% (20) |
| Southern Miss | 68.5 | 56% (84) | 49% (101) | 63% (51) |
Higher returning production rates don’t guarantee better production, but if the coaching staff stays you can assume a step forward in that direction.
Four of Troy’s first seven opponents went through a coaching change last year. Thus you could project Arkansas State’s offense is getting better, Georgia Southern’s defense will improve… and Louisiana should have a better season overall.
On the other hand, a coaching change can cause low return rates, so as in Troy, ULM and South’s cases, you should rationally expect a step backward.
In fact, that’s basically how to read these percentages. How much statistical value did your team retain?
Here’s how Bill Connelly explains it:
[SP] projections stem from three primary questions: How good has your team been recently? How well has it recruited? And who returns from last year’s roster? SP+ projections come next week, but let’s go ahead and deal with that last question. Who returns a majority of last year’s production (or has done the best job of importing production from another team)? Who is starting from scratch?
Memphis, Iowa, Arkansas State and Louisiana are the only teams with return rates in the national top 75—top 30 even. Two are non-conference opponents who will be favored, but the Cajuns and Red Wolves are road division opponents.
The good news is Arkansas State’s high return rate is mostly its ridiculous offensive starters. The defense only brought back about half its production.
The bad news is Louisiana brought back a ton on both sides of the ball, and their only downside was rushing defense last year.
Also note Texas State’s 65% defensive return rate. Adding an MVP quarterback and reloading on defense is a dangerous combo.
In fact, the top-40 returning production rates correlate with the lowest win probabilities determined by FPI. The four teams I mentioned earlier are projected losses (Iowa, Memphis) or toss-ups (Arkansas State and Louisiana).
Even Georgia Southern is considered a toss-up, with its top-40 returning production on defense.
The only exception is that team in Mobile, which is again in the same boat as Troy.
The conclusion I’ve come to is that Troy’s first five games seem pretty easy to project as far as the win-loss column goes. After that, it’s a crapshoot because of the roster changes and road matchups.
Almost like preseason rankings almost don’t matter, huh.
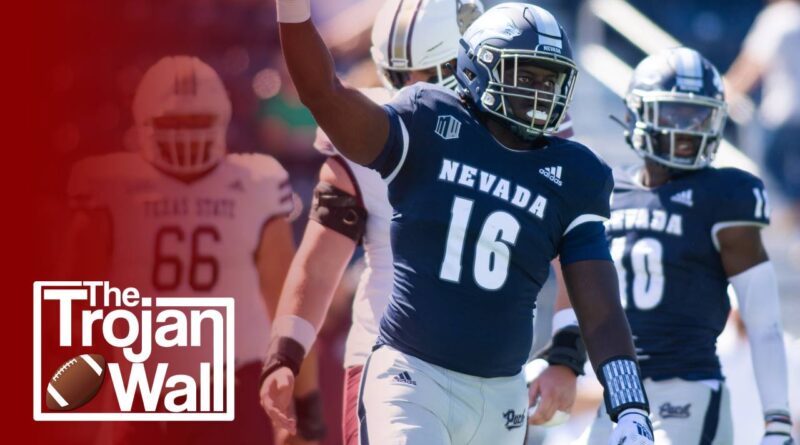
The first challenge is a team that may look down, but it has something to prove. I’ll be back next week with a more in-depth preview of Nevada.
I’ll leave you with the full glorious table of data, so you can compare teams for yourself.
| Team | FPI Win% | Ret Prod/Rk | 23 Rush Off/Rk | 23 Pass Off/Rk | Ret Off/Rk | 23 Rush Def/Rk | 23 Pass Def/Rk | Ret Def/Rk |
|---|---|---|---|---|---|---|---|---|
| Nevada* | 82.5 | 59% (79) | 124.8 (98) | 175.2 (111) | 62% (65) | 187.8 (117) | 254.1 (112) | 55% (79) |
| @ Memphis | 39.4 | 69% (26) | 152.0 (75) | 306.5 (10) | 74% (29) | 155.2 (77) | 268.0 (121) | 65% (45) |
| @ Iowa | 23.6 | 69% (30) | 115.9 (107) | 118.6 (127) | 80% (12) | 111.8 (15) | 170.7 (5) | 58% (65) |
| Florida A&M* | 96.9 | N/A | 138.1 | 236.5 | N/A | 95.4 | 165.7 | N/A |
| ULM* | 81.8 | 40% (125) | 146.1 (80) | 174.8 (112) | 39% (120) | 170.9 (101) | 274.9 (122) | 41% (117) |
| Texas State | 63.0 | 60% (77) | 186.7 (26) | 270.9 (28) | 54% (91) | 151.3 (69) | 246.3 (100) | 65% (42) |
| @ South* | 53.1 | 41% (120) | 172.0 (48) | 268.2 (32) | 39% (119) | 113.7 (19) | 199.5 (28) | 44% (113) |
| @ AR St | 55.6 | 69% (27) | 147.6 (78) | 226.0 (62) | 82% (8) | 184.2 (113) | 259.4 (119) | 56% (75) |
| Coastal | 60.5 | 45% (114) | 154.6 (69) | 261.6 (38) | 44% (112) | 167.8 (97) | 211.8 (44) | 46% (111) |
| @ GASO | 55.9 | 50% (97) | 117.2 (106) | 302.2 (13) | 35% (124) | 161.4 (86) | 234.5 (80) | 66% (40) |
| @ Louisiana | 53.4 | 73% (13) | 175.7 (41) | 216.7 (74) | 73% (31) | 170.8 (100) | 215.0 (51) | 73% (20) |
| Southern MS | 68.5 | 56% (84) | 162.8 (58) | 190.7 (101) | 49% (101) | 178.8 (111) | 242.0 (96) | 63% (51) |