

Campaign Success: Troy’s record in election years
Author’s Note: This post is not intended to be political at all. This is simply a fun exercise in two of my passions: Troy University Football and U.S. Presidential History.
Every four years, Americans from all walks of life come together to exercise one of their central duties as an American citizen: voting for the President. Whether or not we agree on the candidates, we go to polling places and make decisions that will direct the country for the next four years. If there is anything Americans enjoy more than passionately debating politics, it’s debating sports. With that in mind, I decided to look at the history of presidential elections through the lens of Troy’s football history.
Troy has a long and storied football history dating back to 1909 when our first games were played. Due to circumstances out of its control, the team skipped many years: 1913-1920 (World War I), 1929 (Great Depression), and 1943-45 (World War II). In that time, the country held three elections, so there is no data for 1916, 1920, and 1944. Data is available for every other election year from 1912 to 2016. (This post will be updated after the 2020 election and the 2020 football season.)
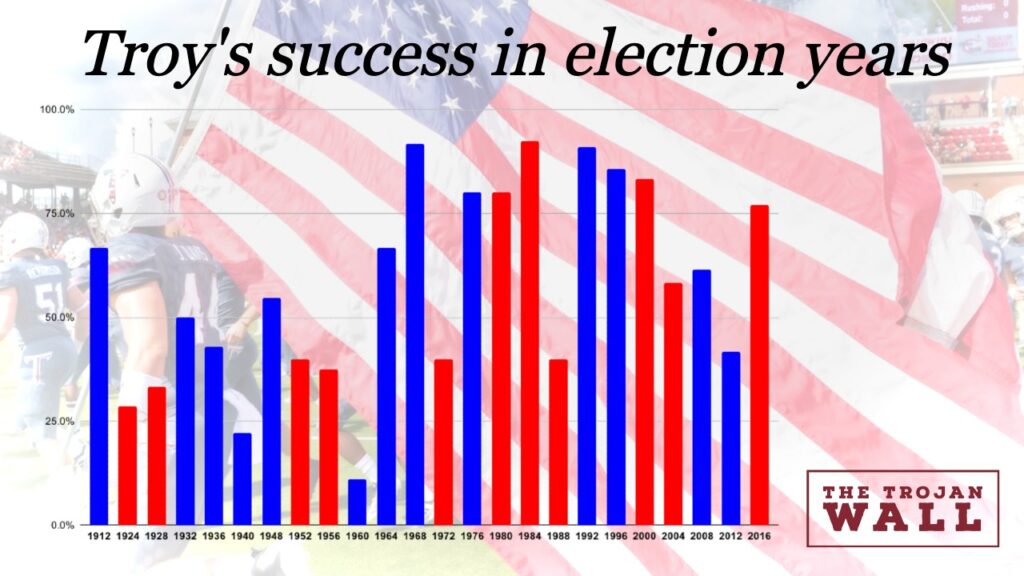
That means the Trojans have played in 24 different election years. During those years, Troy has played 243 games with a 145-88-10 record (a 59.67% win percentage). In election years, the Trojans have won 2 National Championships, 7 conference championships and 14 winning seasons. Troy also had one bowl win.
As one might expect for Troy, most of the team’s successful seasons (Election years or not) have come in the post-1968 era. For a more in-depth look at the numbers, let’s break this down by party.

In years that the Democratic Party won the White House, Troy has had a winning season in 9 of the 13 seasons. Overall, the Trojans won 81 games against 48 losses and 4 ties during Election years when a Democrat was elected. This amounts to a 60.90% win rate. Troy also won a National Title during the 1968 Election Year (LBJ) and took home 4 Conference titles (1968, 1976, 1996, and 2008).
The best election year seasons based on win percentage came in 1968 (91.7%), 1992 (90.9%), 1996 (85.7%), and 1976 (80%). These were the only seasons in which Troy finished over 75% in win percentage and the Democrats won that year’s presidential election.
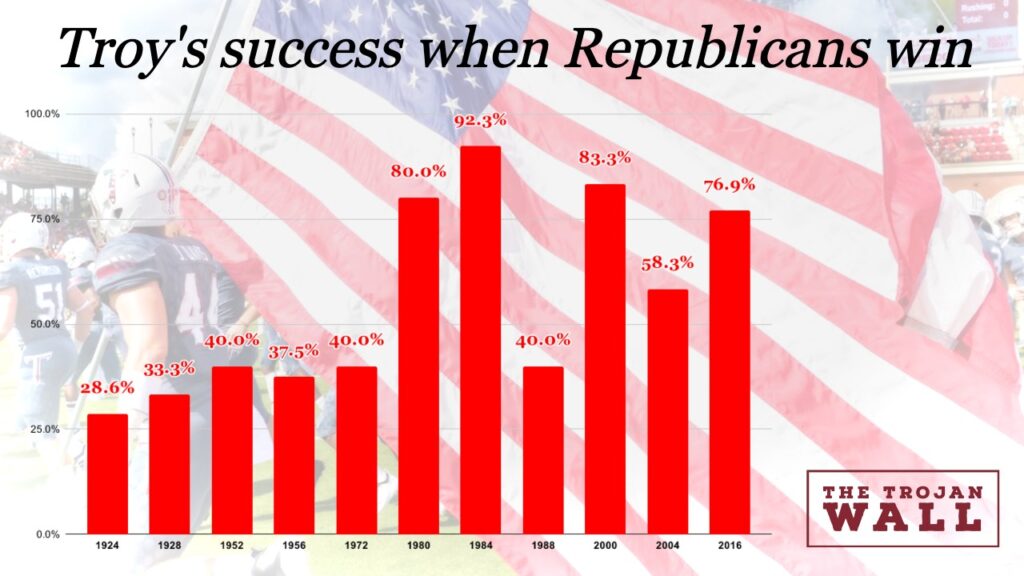
The years Republicans took the White House align with 5 winning seasons and 6 losing seasons. This resulted in a slightly lower record (64-40-6) and win percentage (58.18%). As for titles, Troy brought home one National Championship during a Republican victory (1984, Reagan) and three conference titles (1984, 2000, 2016). 2016 also added a bowl win for Troy, this time in the Dollar General Bowl. It was the first bowl win during an election year.
The best seasons for Republican election years were 1984 (92.3), 2000 (83.3%), 1980 (80%), and 2016 (76.9%). As with the Democrats, these were the only four election year seasons that Troy finished above .500 with a Republican winner.
While the Democrats hold a slight edge in overall wins, win percentage, and conference championships, the data proves one thing. No matter which party wins, Troy will more often than not have great success during election years.